

Market Note
Another V-Shaped Recovery
Risk was clearly embraced during the month of April 2026.
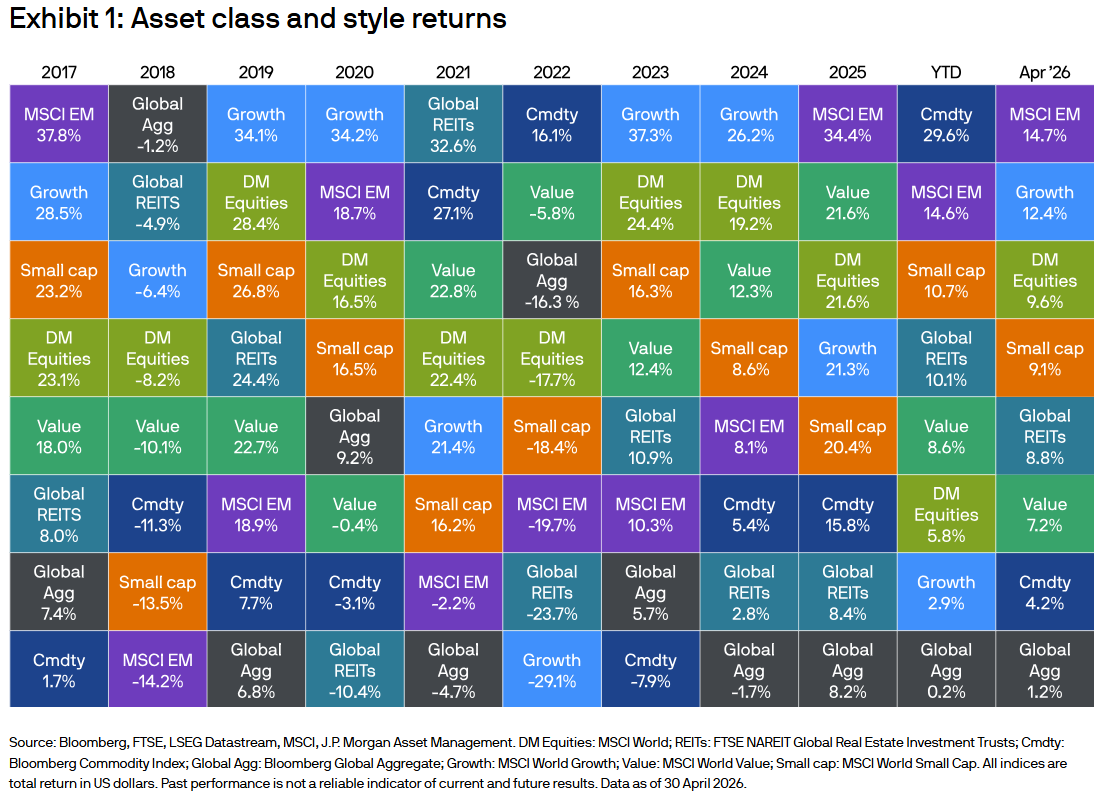
Chart Source(s): J.P. Morgan Asset Management
The snap back in high velocity risk seeking flows is following similar post market shock episodes like the pandemic in March 2020, SVB March 2024 and Liberation Day April 2025.
Market violence and turbulence to the upside and downside in rapid speed has become the ongoing dynamic in price action.
Hedge funds are getting better at adapting to the V-shaped movements, evidenced by the strong returns from hedge funds last month and YTD.
Recent laggards are understandably value oriented strategies while pro-growth books are synchronizing well with the prevailing market tailwinds.
Global Markets & Economic Data
In April 2026, global markets staged a remarkable comeback with the Nasdaq soaring 15.3% (its best performance since November 2020) and the S&P 500 climbing 10.5%, driven by a powerful surge in artificial intelligence and technology stocks. Emerging markets followed suit, with the MSCI Emerging Markets index jumping 14.7%, particularly bolstered by extraordinary gains in Taiwan and South Korea’s semiconductor sectors. Despite ongoing geopolitical tensions with Iran and Brent crude hovering above $110 per barrel, corporate earnings remained robust and growth equities decisively outperformed value stocks. The broader market landscape saw a 4.2% gain in commodities, with energy and industrial metals leading the charge, while fixed income markets delivered a modest 1.2% return amid rising bond yields. Underpinning this resilient market performance were persistent inflation concerns, geopolitical uncertainties, and a cautious Federal Reserve, all set against a backdrop of 2.0% Q1 US GDP growth—a testament to the core resilience that remains in the US economy, mostly driven by AI CapEx.
Index Returns Summary
| Asset Class | MTD | YTD |
|---|---|---|
| MSCI World | 9.64% | 6.17% |
| MSCI Asia Pacific | 8.06% | 10.03% |
| MSCI Europe | 7.26% | 4.58% |
| MSCI China | 3.64% | -5.29% |
| Bloomberg Barclays Global Aggregate Index | 1.25% | 0.18% |
| Bloomberg Commodities Index | 3.89% | 27.28% |
| HFRX Global | 2.98% | 2.41% |
| HFRX Macro/CTA | 2.83% | 4.39% |
| HFRX Equity Hedge | 5.43% | 3.95% |
*Index data as of April 30, 2026
Disclaimer: This material has been prepared by MASTERPIECE ADVISORS for informational purposes only and should not be construed as financial advice. Investments in hedge funds are speculative and involve a high degree of risk. This material is confidential and may not be disclosed without the express written approval of MASTERPIECE ADVISORS.