

Market Note
Back to “11”
US investor risk seeking appetite was clearly not dented by July’s market price swings. The sector/factor wars under the surface have rapidly left front page news after Situational Awareness and we are back to the “bullish” goldilocks market backdrop.
Here we return to all-time highs as the most recent bout of “market volatility” inflicted damage only on those exposed to segments of the market while the broader stock market indices cruised by unscathed.
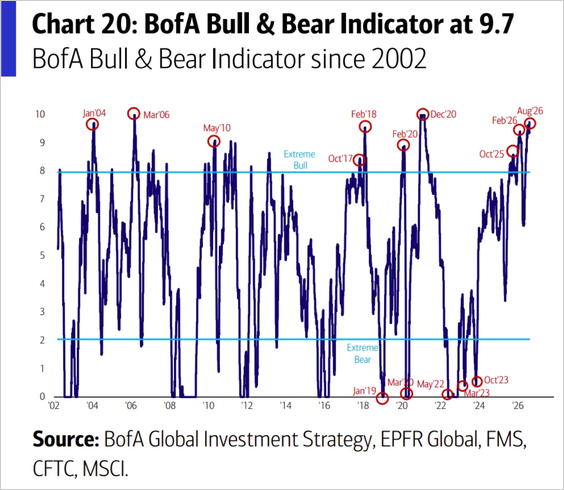
Chart Source(s): BofA Global Investment Strategy, EPFR Global, FMS, CFTC, MSCI
Bull Case for US equities
Underpinning the bull case for US equities are robust earnings growth, record earnings momentum and historic net profit margins.
Bear Case for US equities
As we oversee long/short exposures, it would be remiss to not layout the bear case as well.
Rich valuations: US equities are trading at 24x to 26x forward P/E, all-time highs. The Buffet Indicator that measures the aggregate value of equities as a % of US GDP is at all-time highs of 200%, which indicates US stock market growth is far outpacing the growth of the real economy.
Tight Financial Conditions: Elevated funding costs and interest rate risks remain present leading to stress on corporate balance sheets which is hurting smaller companies with limited financing options.
Stressed Consumer: Retail sales growth is in a downtrend spurred on by dwindling savings and elevated credit card balances. Also, industrial manufacturing activity remains tepid with PMIs around neutral.
Bad Breadth: Finally, stock indices are over-reliant on mega-cap growth, if earnings falter for the market leaders then overall US equity fundamentals will decelerate sharply.
Index Returns Summary
| Index | MTD | YTD |
|---|---|---|
| MSCI World | 0.53% | 10.48% |
| MSCI Asia Pacific | 2.70% | 15.79% |
| MSCI Europe | 1.62% | 9.95% |
| MSCI China | 4.91% | -10.00% |
| Bloomberg Barclays Global Aggregate Index | -0.53% | -0.73% |
| Bloomberg Commodities Index | 7.20% | 19.58% |
| HFRX Global | -1.13% | 3.67% |
| HFRX Macro/CTA | -1.52% | 4.19% |
| HFRX Equity Hedge | -2.11% | 6.56% |
*Index data as of July 31, 2026
Disclaimer: This material has been prepared by MASTERPIECE ADVISORS for informational purposes only and should not be construed as financial advice. Investments in hedge funds are speculative and involve a high degree of risk. This material is confidential and may not be disclosed without the express written approval of MASTERPIECE ADVISORS.