

Market Note
Asian Equity Long/Short!
An uptick in market volatility has been driven by seasonality induced market illiquidity, consolidating and ever-rotating tech/AI leadership, and increased uncertainty regarding the medium-term trajectory of US interest rates.
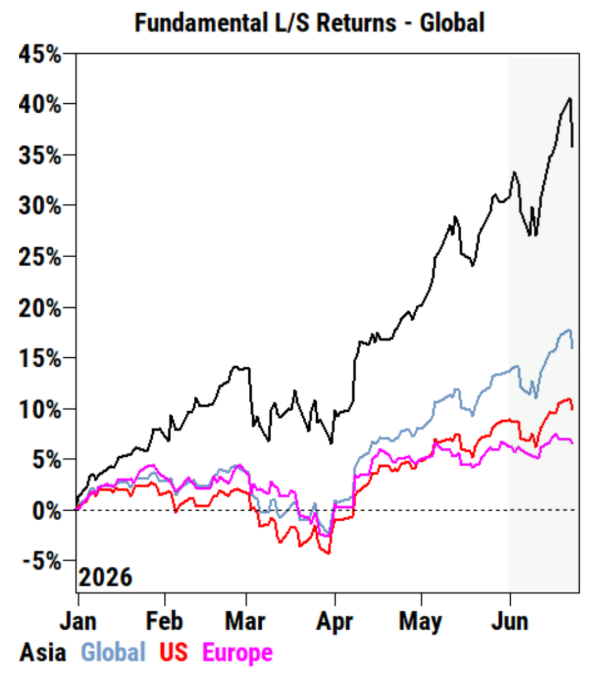
Chart Source(s): Goldman Sachs
We are observing some eye-popping YTD figures from Asian Equity Long/Short exposures. In fact we congratulated one China AI EQ L/S PM a few weeks ago for making 50% YTD returns and they said it was bittersweet because leading peers are up twice that much, if not more.
Over-sized return generation from Asia is not just a function of speculative over-risked AI theme chasing, it stems from the hardwired approach of Asian investors to identifying tech product cycles and opportunity sets across vertical supply chains.
Asian Equity Long/Short hedge funds have successfully transposed the template from PC and smartphone product cycles in the past to the potent Asia/China AI universe of tech and industrial companies. Korea and Taiwan have the memory, China has the AI infrastructure and Japan has the semiconductor tools.
One observation from a smart Asian allocator is insightful as well; Asian Equity Long/Short funds often focus more on the opportunity set ahead for companies in the midst of product cycles, which is not yet reflected in the numbers, while more traditional stock pickers from the US and Europe are lagging or struggling this year if they wait for the numbers to justify current valuations.
Global Markets & Economic Data
- US: PCE data was inline, but running at 4.1% y/y above the 2% annual rate the Fed is comfortable with. US New Home Sales data were weak as 30-year mortgage rates remained elevated at 6.59%.
- Switzerland/UK/Europe: The Swiss Q1 Current Account surplus contracted, driven by a reduction in the goods account surplus. UK May Retail Sales were above expectations. German May PPI data was below forecast.
- Japan/China: The yield on the Japanese 5-year bond eased to 1.88%, the yield has fallen by 6bps over the past month but remains 90bps above the yield level 12-months ago. Chinese FDI fell 8.6% y/y in May, not as bad as expected.
Index Returns Summary
| Asset Class | MTD | YTD |
|---|---|---|
| MSCI World | -0.68% | 10.03% |
| MSCI Asia Pacific | 1.19% | 15.57% |
| MSCI Europe | 0.11% | 7.41% |
| Bloomberg Barclays Global Aggregate Index | -0.76% | -0.25% |
| Bloomberg Commodities Index | -6.06% | 17.21% |
| HFRX Global | 0.69% | 4.83% |
| HFRX Macro/CTA | 0.05% | 6.70% |
| HFRX Equity Hedge | 1.45% | 8.30% |
*Index data as of June 19, 2026
Disclaimer: This material has been prepared by MASTERPIECE ADVISORS for informational purposes only and should not be construed as financial advice. Investments in hedge funds are speculative and involve a high degree of risk. This material is confidential and may not be disclosed without the express written approval of MASTERPIECE ADVISORS.