

Market Note
The ROW trade remains intact
April 3rd, 2026
Month-end featured a breathtaking relief rally that started to lose momentum into the long holiday weekend, but US equity indices finished the shortened week positive for the first time since February.
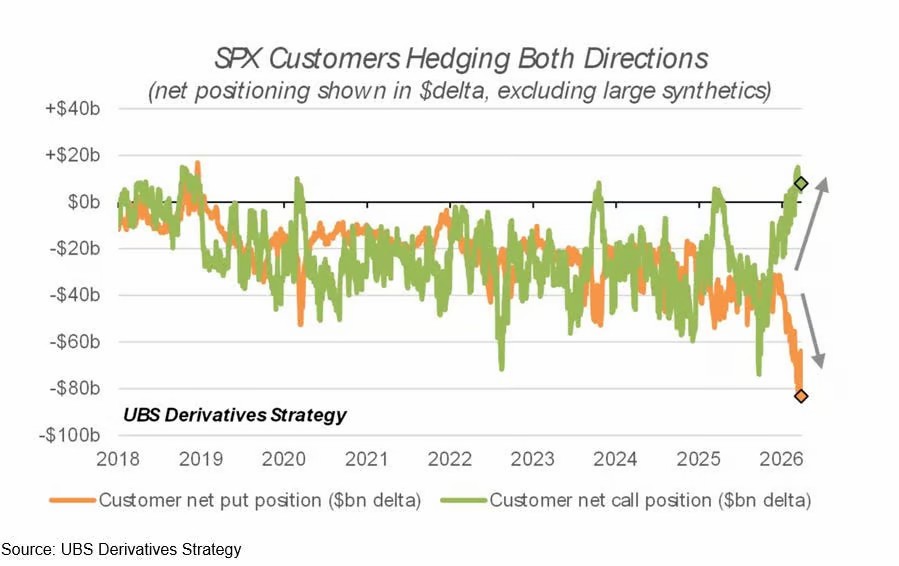
Chart Source(s): UBS Derivatives Strategy
The current two-sided market environment is leading to an upswing in options trading, especially in ETFs and equity indices.
Global Markets & Economic Data
- US: March payrolls data surprised to the upside beating consensus by over 100k jobs and the unemployment rate ticked lower to 4.3%. The US Case Shiller home price index fell to the lowest annual growth rate since 2023 with home price appreciation lagging inflation for an eighth straight month.
- Switzerland/UK/EU: Swiss KOF leading indicators data fell in March to the lowest level since Jun. 2025. UK Feb. retail sales fell 0.4% m/m. Germany’s March inflation rate increased to 2.7% y/y.
- Japan/China: Japan’s Q1 Tankan index trended higher, above estimates. China’s Mar. Manufacturing PMI dropped to 50.8, just barely in expansionary territory.
Index Returns Summary
| Asset Class | MTD | YTD |
|---|---|---|
| MSCI World | -6.32% | -3.28% |
| MSCI Asia Pacific | -11.18% | 3.63% |
| MSCI Europe | -9.80% | -1.90% |
| MSCI China | -7.69% | -9.03% |
| Bloomberg Barclays Global Aggregate Index | -3.07% | -1.00% |
| Bloomberg Commodities Index | 11.15% | 22.16% |
| HFRX Global | -2.95% | -0.50% |
| HFRX Macro/CTA | -3.66% | 1.76% |
| HFRX Equity Hedge | -4.44% | -1.34% |
*Index data as of March 31, 2026
Market Spotlight: Lower nets, higher gross
The elevated level of activity was driven by the shock of the war developments coming at a time of relatively elevated HF net exposure levels, which were at multi-year peaks through February.
As the HFs reduced net, many opted to increase portfolio hedging leading to a step-up in total gross exposure levels in the industry.
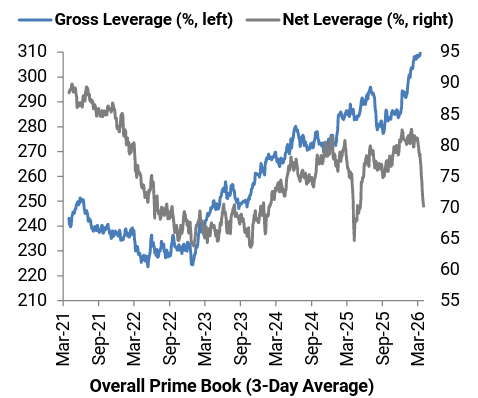
Chart Source(s): Goldman Sachs
The elevated gross exposure continues to signal that further de-grossing volumes are still to come if geopolitics continues to take unexpected turns.
Market Spotlight: The ROW trade remains intact
Going forward we anticipate the ROW trade to snap back, especially the Asian leg if/when the Iran war reaches its conclusion.
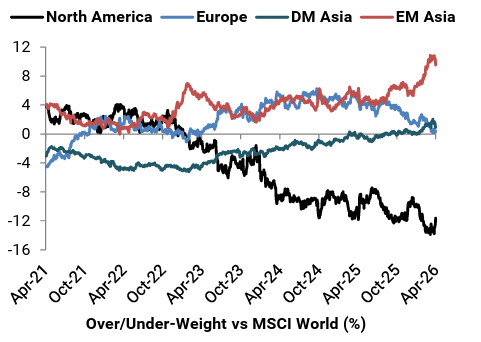
Chart Source(s): Goldman Sachs
The fall in North American relative weights has been many years in the making, benefitting the ROW.
Notably, European overweight exposures peaked in 2025 and have been trending downwards while Asian exposure remain on a strong uptrend with EM Asia recently seeing a spike higher.
Unfortunately, March was quite punitive for HFs setup long ROW, short US with Asian and European equities falling more severely than equities in the US. Technically the selling was driven by de-risking while fundamentally various energy and geopolitical related headwinds are damaging sentiment towards the trade.
Market Spotlight: Industrials selling
Many high quality industrials stocks are now on sale in the stock market.
The steep fall in industrials (especially aerospace and defense) recently is another example of the market always moving in the direction to cause the most pain.

Chart Source(s): Koyfin
Fundamentally, military restocking, infrastructure rebuilds and supply shortages should create a self perpetuating business cycle for companies engaged in the defense and aerospace industry. However, the ITA aerospace and defense ETF has lost twice as much as the S&P 500 over the past month further amplifying hedge fund losses.
The big selling witnessed in recent weeks in the industrials sector could be in reaction to the non-fundamental weakness in the sector as industrials PMs at multi-strategy firms are forced to cut their books in the wake of losses.
Market Spotlight: Is it over?
Professional investors are observing a wide disconnect in markets currently between the major physical commodity supply shocks hitting the heavily intertwined global economy and the financial markets.
The selloff in the S&P 500 has come nowhere close to the severity in percentage lost and the speed of decline versus the typical start of bear markets.
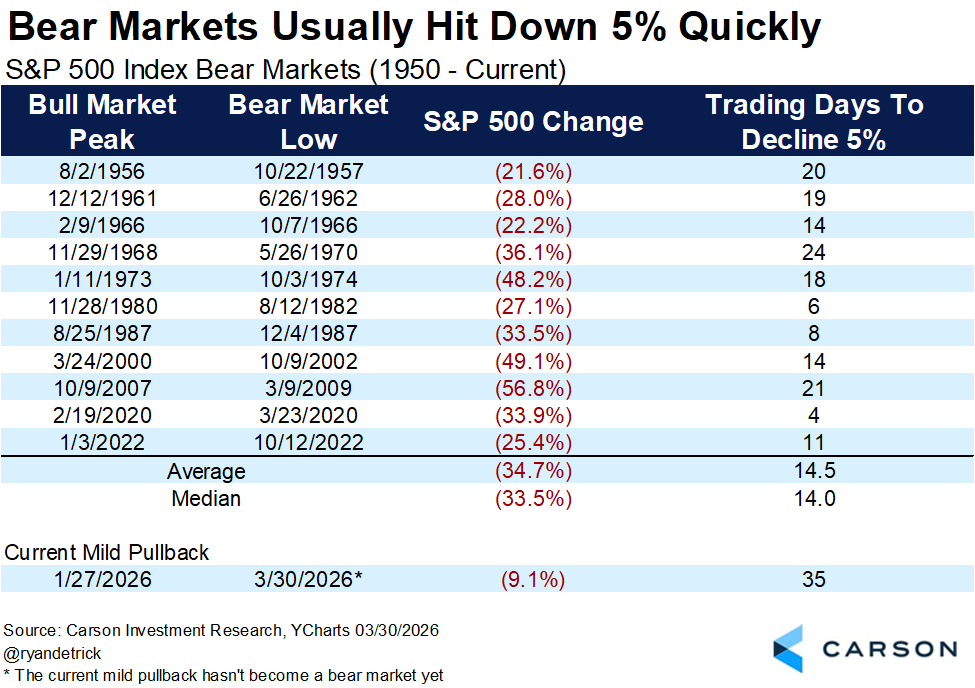
Chart Source(s): Carson Investment Research
One can interpret this data point in either direction. On the bullish side, resilience thus far in equities is confidence boosting that a recovery is possible when geopolitical stability emerges.
On the bearish side, the lack of a clear panic moment thus far could just be a technical aberration with far deeper plunges ahead if/when adverse scenarios begin (continue) unfolding in the middle east.
Market Spotlight: 60/40 YTD Returns
A contributor to the rally at month-end was US pension fund rebalancing into equities after the quarterly loss.
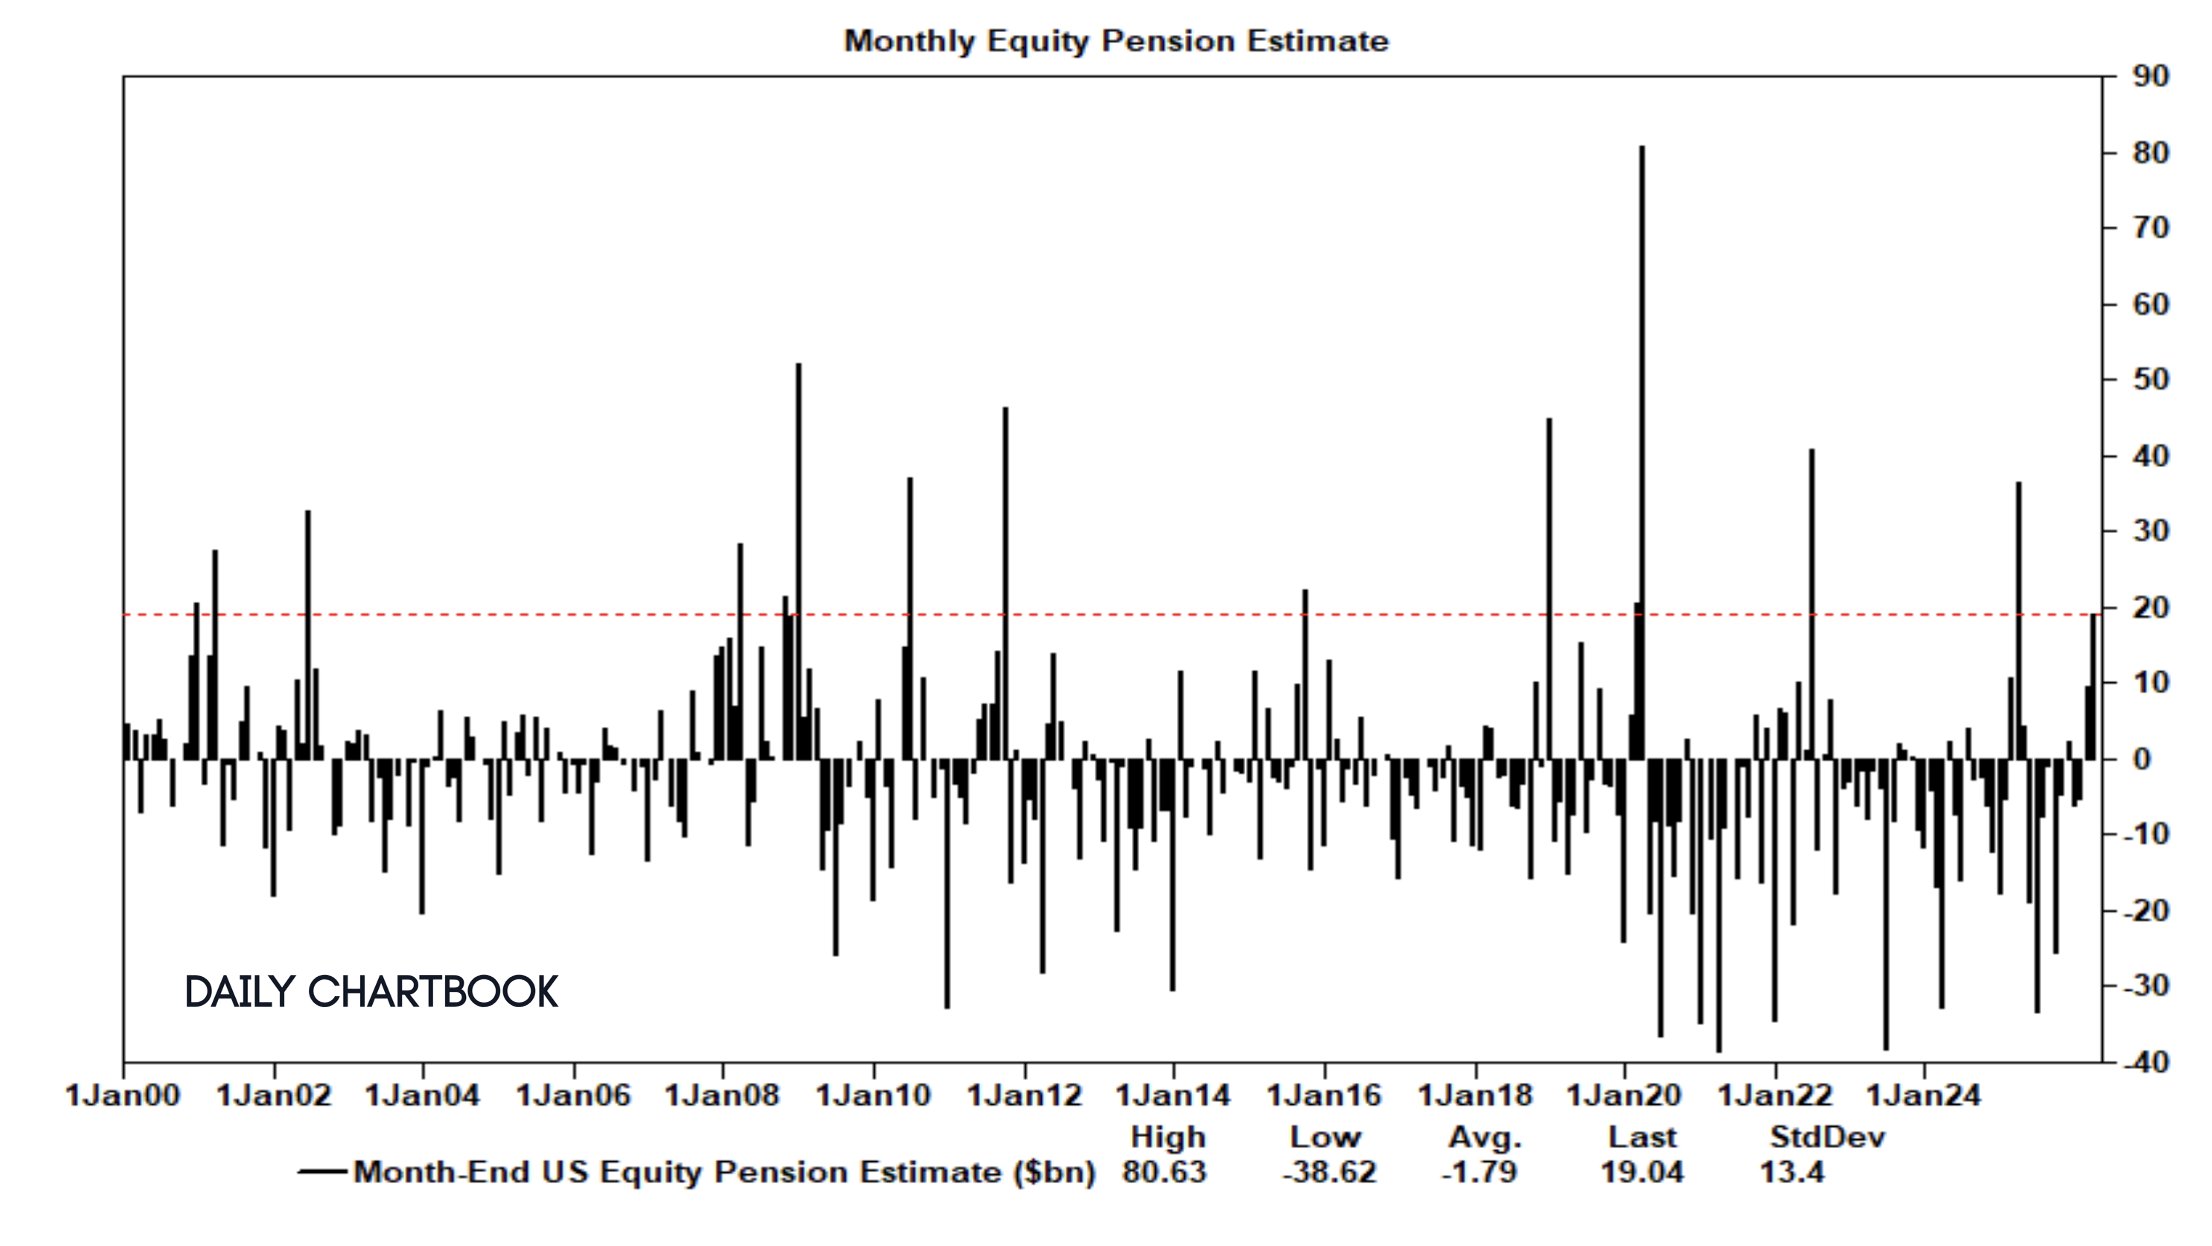
Chart Source(s): Daily Chartbook
We simulated a simple 60/40 portfolio YTD performance (60% SPY, 40% TLT). The portfolio was trending positively through February supported by an uptick in bonds. However, over the past month the portfolio performed poorly losing 6.5% peak to trough.
We do observe that in recent trading days that bond/stock correlations are starting to normalize, which could signal the market shifting from inflation fears to growth fears, but one technical dynamic against US bonds today is growing ex-US investor selling pressure inspired by frustration over US military actions.
Have Questions or Want to Learn More?
Our team is ready to provide further insights into our strategies and the current market landscape. Reach out to us today.
Contact UsDisclaimer: This material has been prepared by MASTERPIECE ADVISORS for informational purposes only and should not be construed as financial advice. Investments in hedge funds are speculative and involve a high degree of risk. This material is confidential and may not be disclosed without the express written approval of MASTERPIECE ADVISORS.