

Market Note
Equal-weight is Great!
February 13th, 2026
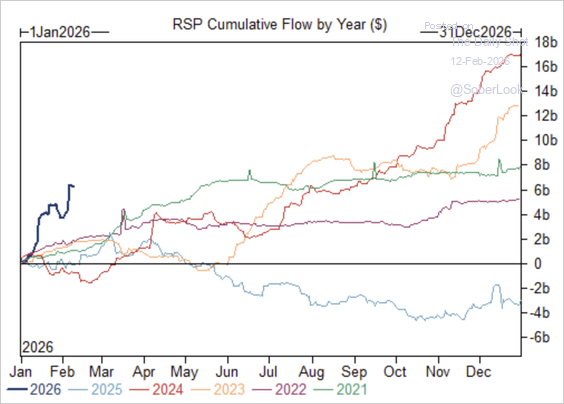
RSP equal weight S&P 500 ETF receives $6b of inflows since the start of the year
Chart Source(s): SoberLook
We are observing risk-taking gridlock across markets driven by technical and fundamental rotations that are triggering de-grossing, which amplifies the daily price movements.
Gone are the days of investors bemoaning "narrow-market breadth". The latest grievances are coming from a shocking broadening in market leadership as former market champions take a pause or in some instances, a header as their share prices plummet lower.
The investing public is adapting, buying up a backwaters ETF called RSP that provides returns of the equal weight S&P 500. This ETF has received $6b of inflows since the start of the year.
Interestingly, in this passive flows driven world, these inflows are themselves creating a self fulfilling trend to further broaden out S&P 500 leadership.
Global Markets & Economic Data
- US: January NFP labor data was better than expected, but previous prints were revised lower. The unemployment rate edged lower to 4.3%. January CPI data was up 2.4% y/y, 0.2% m/m, below forecasts. January retail and housing data was lower, heavily influenced by inclement weather.
- Switzerland/Europe/UK: The Swiss January unemployment rate ticked up slightly to 3.2% from 3.1% previous and consumer confidence showed a small m/m improvement. UK Q4 GDP was weaker than expected, signaling the economy is near entering a technical recession. Eurozone data signaled inflation trending lower while economic data remained soft.
- Japan/China: Upward trending Japanese inflation data support the expectation for the BoJ to hike rates further. Chinese inflation data was subdued amongst continue economic stagnation so further Chinese government stimulus measures would be a welcome development.
Index Returns Summary
| Asset Class | MTD | YTD |
|---|---|---|
| MSCI World | 0.04% | 2.23% |
| MSCI Asia Pacific | 1.02% | 7.70% |
| MSCI Europe | 0.28% | 4.69% |
| MSCI China | -3.91% | 0.75% |
| Bloomberg Barclays Global Aggregate Index | -0.22% | 0.72% |
| Bloomberg Commodities Index | -2.27% | 7.85% |
| HFRX Global | 0.19% | 2.19% |
| HFRX Macro/CTA | 0.15% | 4.15% |
| HFRX Equity Hedge | 0.15% | 2.41% |
Index data as of February 6, 2026
Market Spotlight: Tech: From Hero to Zero
Tech is better sold in 2026. After the massive run-up over the past three years due to AI excitement, investors are becoming more discerning.

Chart Source(s): The Daily Shot, SoberLook, SubuTrade
Market Spotlight: Dollar bears have awoken
The US presidential administration wants the US dollar lower and investors are taking notice, increasing short positioning to the highest on record.
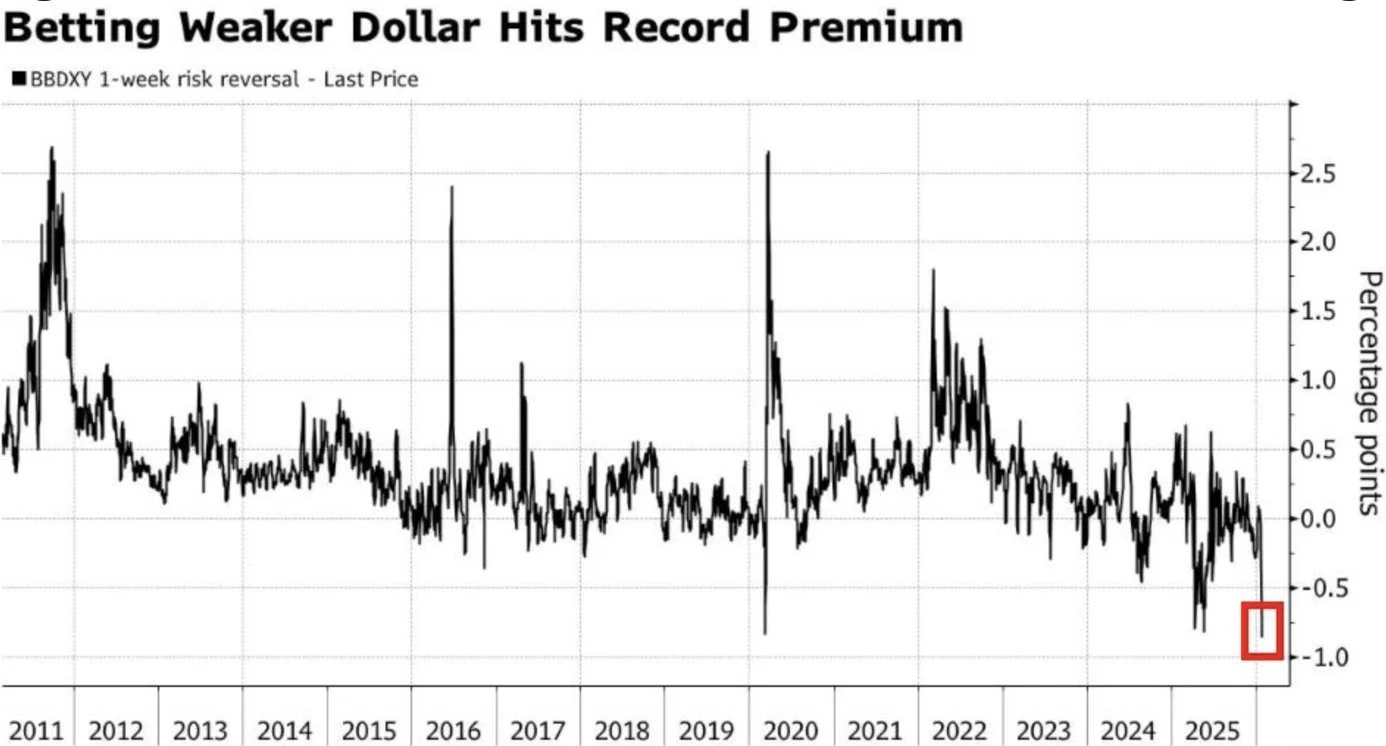
Chart Source(s): Bloomberg
Market Spotlight: Violent commodity moves & flows
Chinese investors hit the bid in gold at the start of the month. Over $1b of Chinese gold ETFs was sold in a matter of days last week.
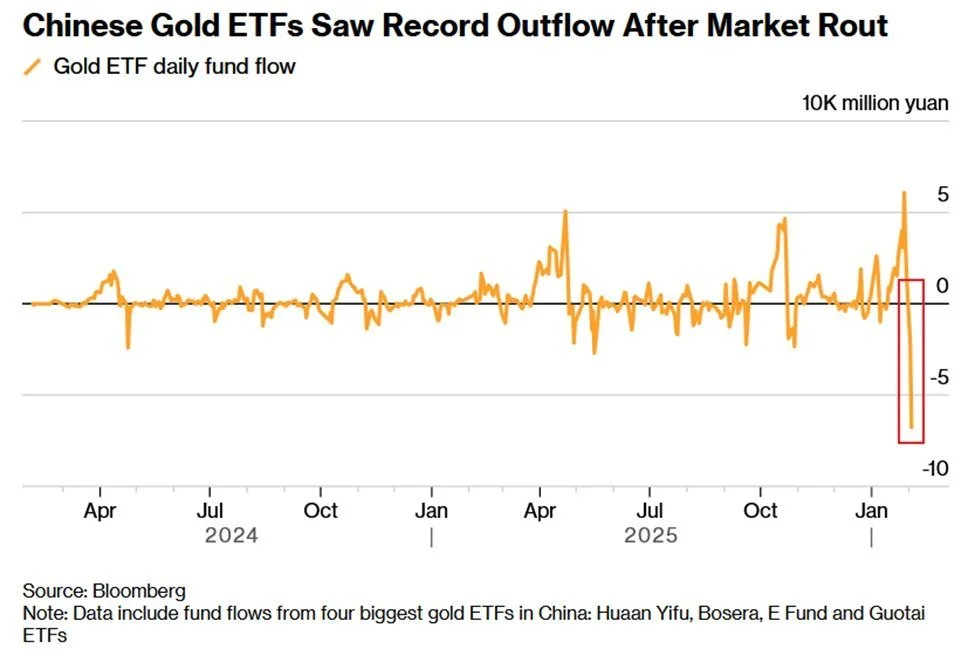
Chart Source(s): Bloomberg
Have Questions or Want to Learn More?
Our team is ready to provide further insights into our strategies and the current market landscape. Reach out to us today.
Contact UsDisclaimer: This material has been prepared by MASTERPIECE ADVISORS for informational purposes only and should not be construed as financial advice. Investments in hedge funds are speculative and involve a high degree of risk. This material is confidential and may not be disclosed without the express written approval of MASTERPIECE ADVISORS.