

Market Note
It's a bull market Everywhere!
February 27th, 2026
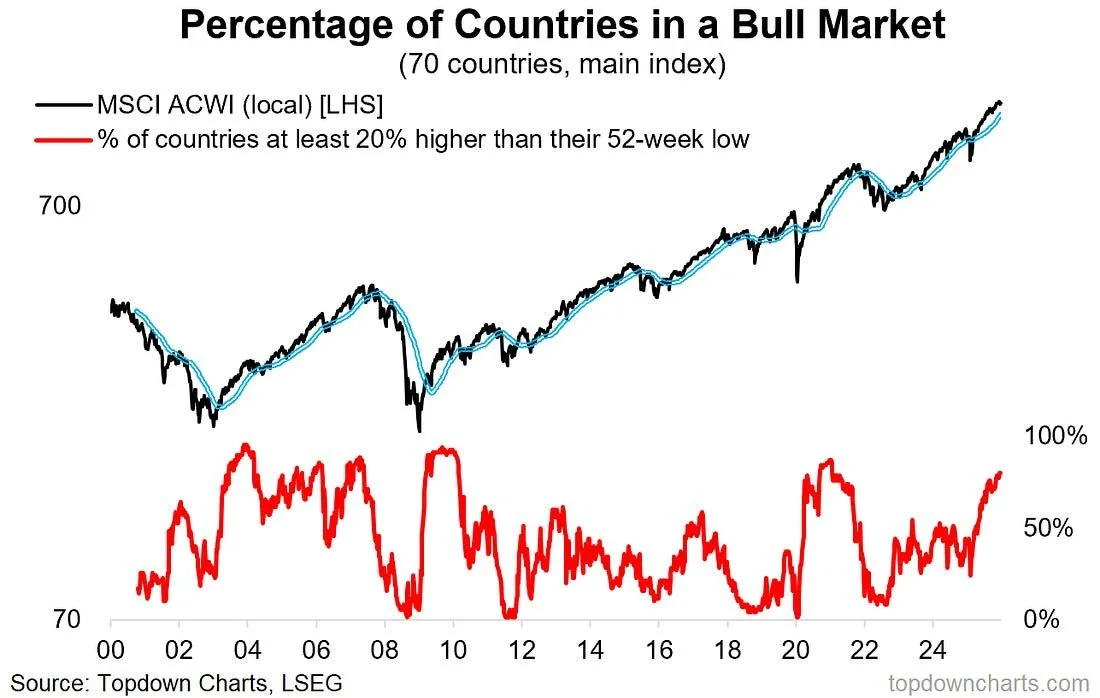
80% of the top 70 equity markets globally are up at least 20% off their 52-week low
Chart Source(s): Topdown Charts, LSEG
Individual US stocks are showing signs of weakness, yet benchmark US indices remain resilient and many global ex-US stock markets are outperforming.
80% of the top 70 equity markets globally are up at least 20% off their 52-week low (with +20% being a common benchmark/trigger for "bull market").
The implications of a global equity bull market are that the US dollar and US assets will be under pressure from global momentum bulls moving their exposures to better opportunities elsewhere.
Global hedge fund investors are beginning to ramp up their ex-US searches, but ones who already made the pivot in recent years are already reaping the benefits from holding dedicated Emerging Markets, European and Asian exposures.
Global Markets & Economic Data
- US: Weekly jobs numbers were better than expected. The KC Fed Industrial PMI inflected into positive territory. The 30-year mortgage rate fell below 6%, its lowest level since 2022.
- Switzerland/Europe/UK: Switzerland's KOF leading indicator improved and economic sentiment rebounded. Euro-area economic sentiment slumped across both services and industrials sectors. STOXX 600 companies announced record-high buybacks in recent months. UK consumer confidence surprised to the downside
- Japan/China: Japan's birthrate fell for a tenth consecutive year. Tokyo core inflation eased below the BoJ's target. HK core inflation is trending lower. Chinese stocks hit a multi-month low.
Index Returns Summary
| Asset Class | MTD | YTD |
|---|---|---|
| MSCI World | 0.70% | 2.96% |
| MSCI Asia Pacific | 5.18% | 11.87% |
| MSCI Europe | 2.51% | 6.97% |
| MSCI China | 5.02% | 9.68% |
| Bloomberg Barclays Global Aggregate Index | 0.62% | 1.56% |
| Bloomberg Commodities Index | -0.84% | 9.28% |
| HFRX Global | 0.16% | 2.16% |
| HFRX Macro/CTA | 0.09% | 4.09% |
| HFRX Equity Hedge | 0.47% | 2.73% |
Index data as of February 20, 2026
Market Spotlight: Private credit concerns rise
Today a UK mortgage provider, MFS applied for “administration.” Several bulge bracket investment banks are negatively impacted.

Chart Source(s): Koyfin
Have Questions or Want to Learn More?
Our team is ready to provide further insights into our strategies and the current market landscape. Reach out to us today.
Contact UsDisclaimer: This material has been prepared by MASTERPIECE ADVISORS for informational purposes only and should not be construed as financial advice. Investments in hedge funds are speculative and involve a high degree of risk. This material is confidential and may not be disclosed without the express written approval of MASTERPIECE ADVISORS.