

Market Note
Nothing to see here
March 6th, 2026
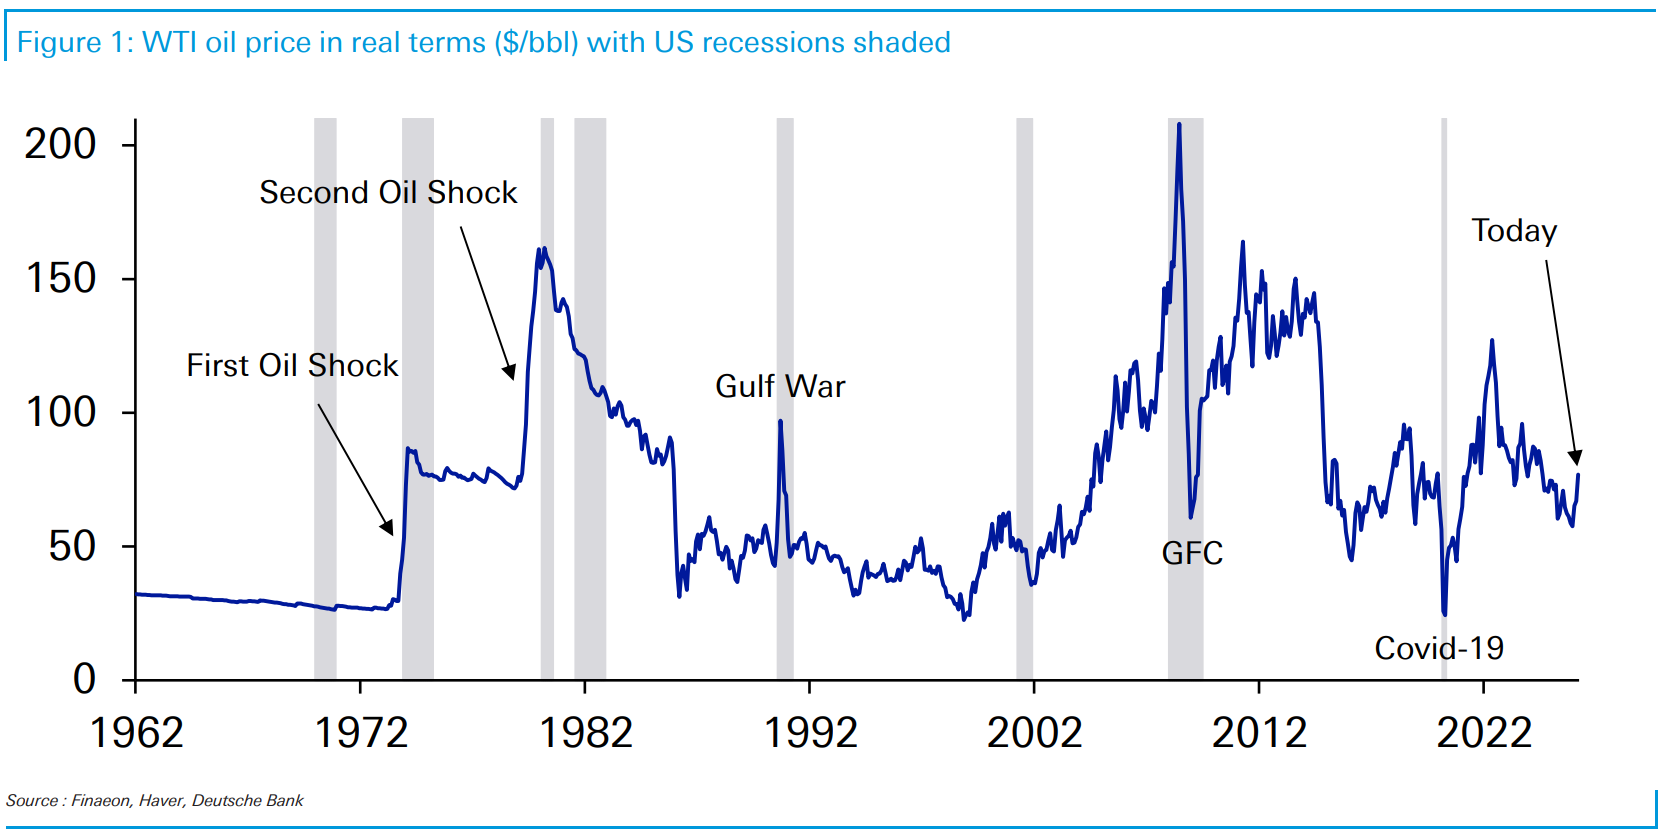
Chart Source(s): Finaeon, Haver, Deutsche Bank
Controlled chaos has ensued in recent days as investors slowly readjust their expectations regarding the timing for when Middle East military activity might de-escalate.
Thus far investors have been quite resilient in the face of an uptick in military activity in the Middle East and an ensuing rise in oil.
Selling is underway on Friday as investors are beginning to understand the military operations in the region could take time to quiet down alongside an unsteady upswing in the price of oil.
Much of what held the markets together in recent months is considered to be a stabilizing force this week such as strong US economic data and a ravenous pavlovian retail crowd buying every dip. When bombs are overhead its clearly time to buy near bankruptcy speculative energy stocks and send them up thousands of percent in a matter of days (reference BATL).
Hedge funds are taking the developments this week in stride, reducing risk while positioning to benefit from opportunities caused by the market dislocations. Generally, commodity traders are on the right side of the energy price movements but we see a dearth of high conviction positioning. One commodity beneficiary is aluminum because GCC countries produces 8-9% of global supply.
Global Markets & Economic Data
- US: US bond rates backed up across the curve registering the largest weekly drop since May 2025 and inflation swap rates are spiking. An investment bank forecasts that a spike of oil to $100 would cost the US ~0.25% in GDP over the next 12 months. Canada and LATAM would be net beneficiaries while Europe would be the largest loser. US economic data points remain robust.
- Europe: European natural gas prices are up 50% this week, the largest weekly rise since 2022. The Euro/USD just broke technical moving average levels. Inflation data has been trending higher across Europe in recent months.
- China: China cut its growth target to the lowest level since 1991. Global Chinese yuan-denominated borrowing has surged to record levels.
Index Returns Summary
| Asset Class | MTD | YTD |
|---|---|---|
| MSCI World | 0.76% | 3.02% |
| MSCI Asia Pacific | 7.61% | 14.30% |
| MSCI Europe | 3.29% | 7.75% |
| MSCI China | -5.77% | -1.11% |
| Bloomberg Barclays Global Aggregate Index | 1.12% | 2.06% |
| Bloomberg Commodities Index | 0.81% | 10.93% |
| HFRX Global | 0.44% | 2.44% |
| HFRX Macro/CTA | 1.36% | 5.36% |
| HFRX Equity Hedge | 0.82% | 3.08% |
*Index data as of February 27, 2026
Market Spotlight: EM under siege
The EM renaissance story is being called into question this week due to a spike in the price of the US dollar.
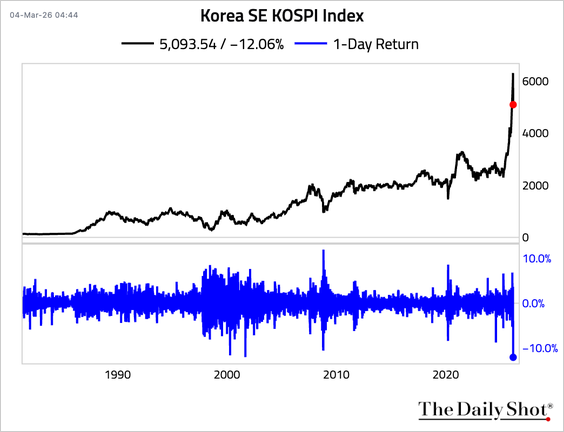
Chart Source(s): The Daily Shot
Market Spotlight: War on Luxe and Consumer Disc Outflows
The Middle East has been a strong growth driver for global luxury brands over the past decades.
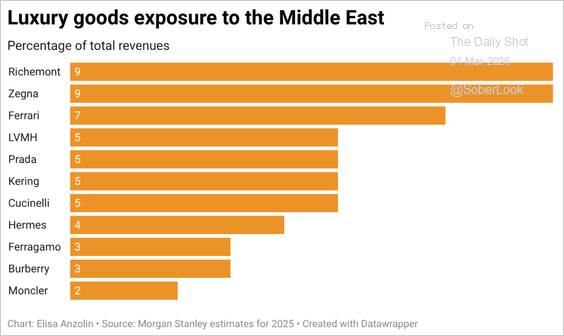
Chart Source(s): Morgan Stanley
Have Questions or Want to Learn More?
Our team is ready to provide further insights into our strategies and the current market landscape. Reach out to us today.
Contact UsDisclaimer: This material has been prepared by MASTERPIECE ADVISORS for informational purposes only and should not be construed as financial advice. Investments in hedge funds are speculative and involve a high degree of risk. This material is confidential and may not be disclosed without the express written approval of MASTERPIECE ADVISORS.