

Market Note
Nowhere to hide
March 13th, 2026
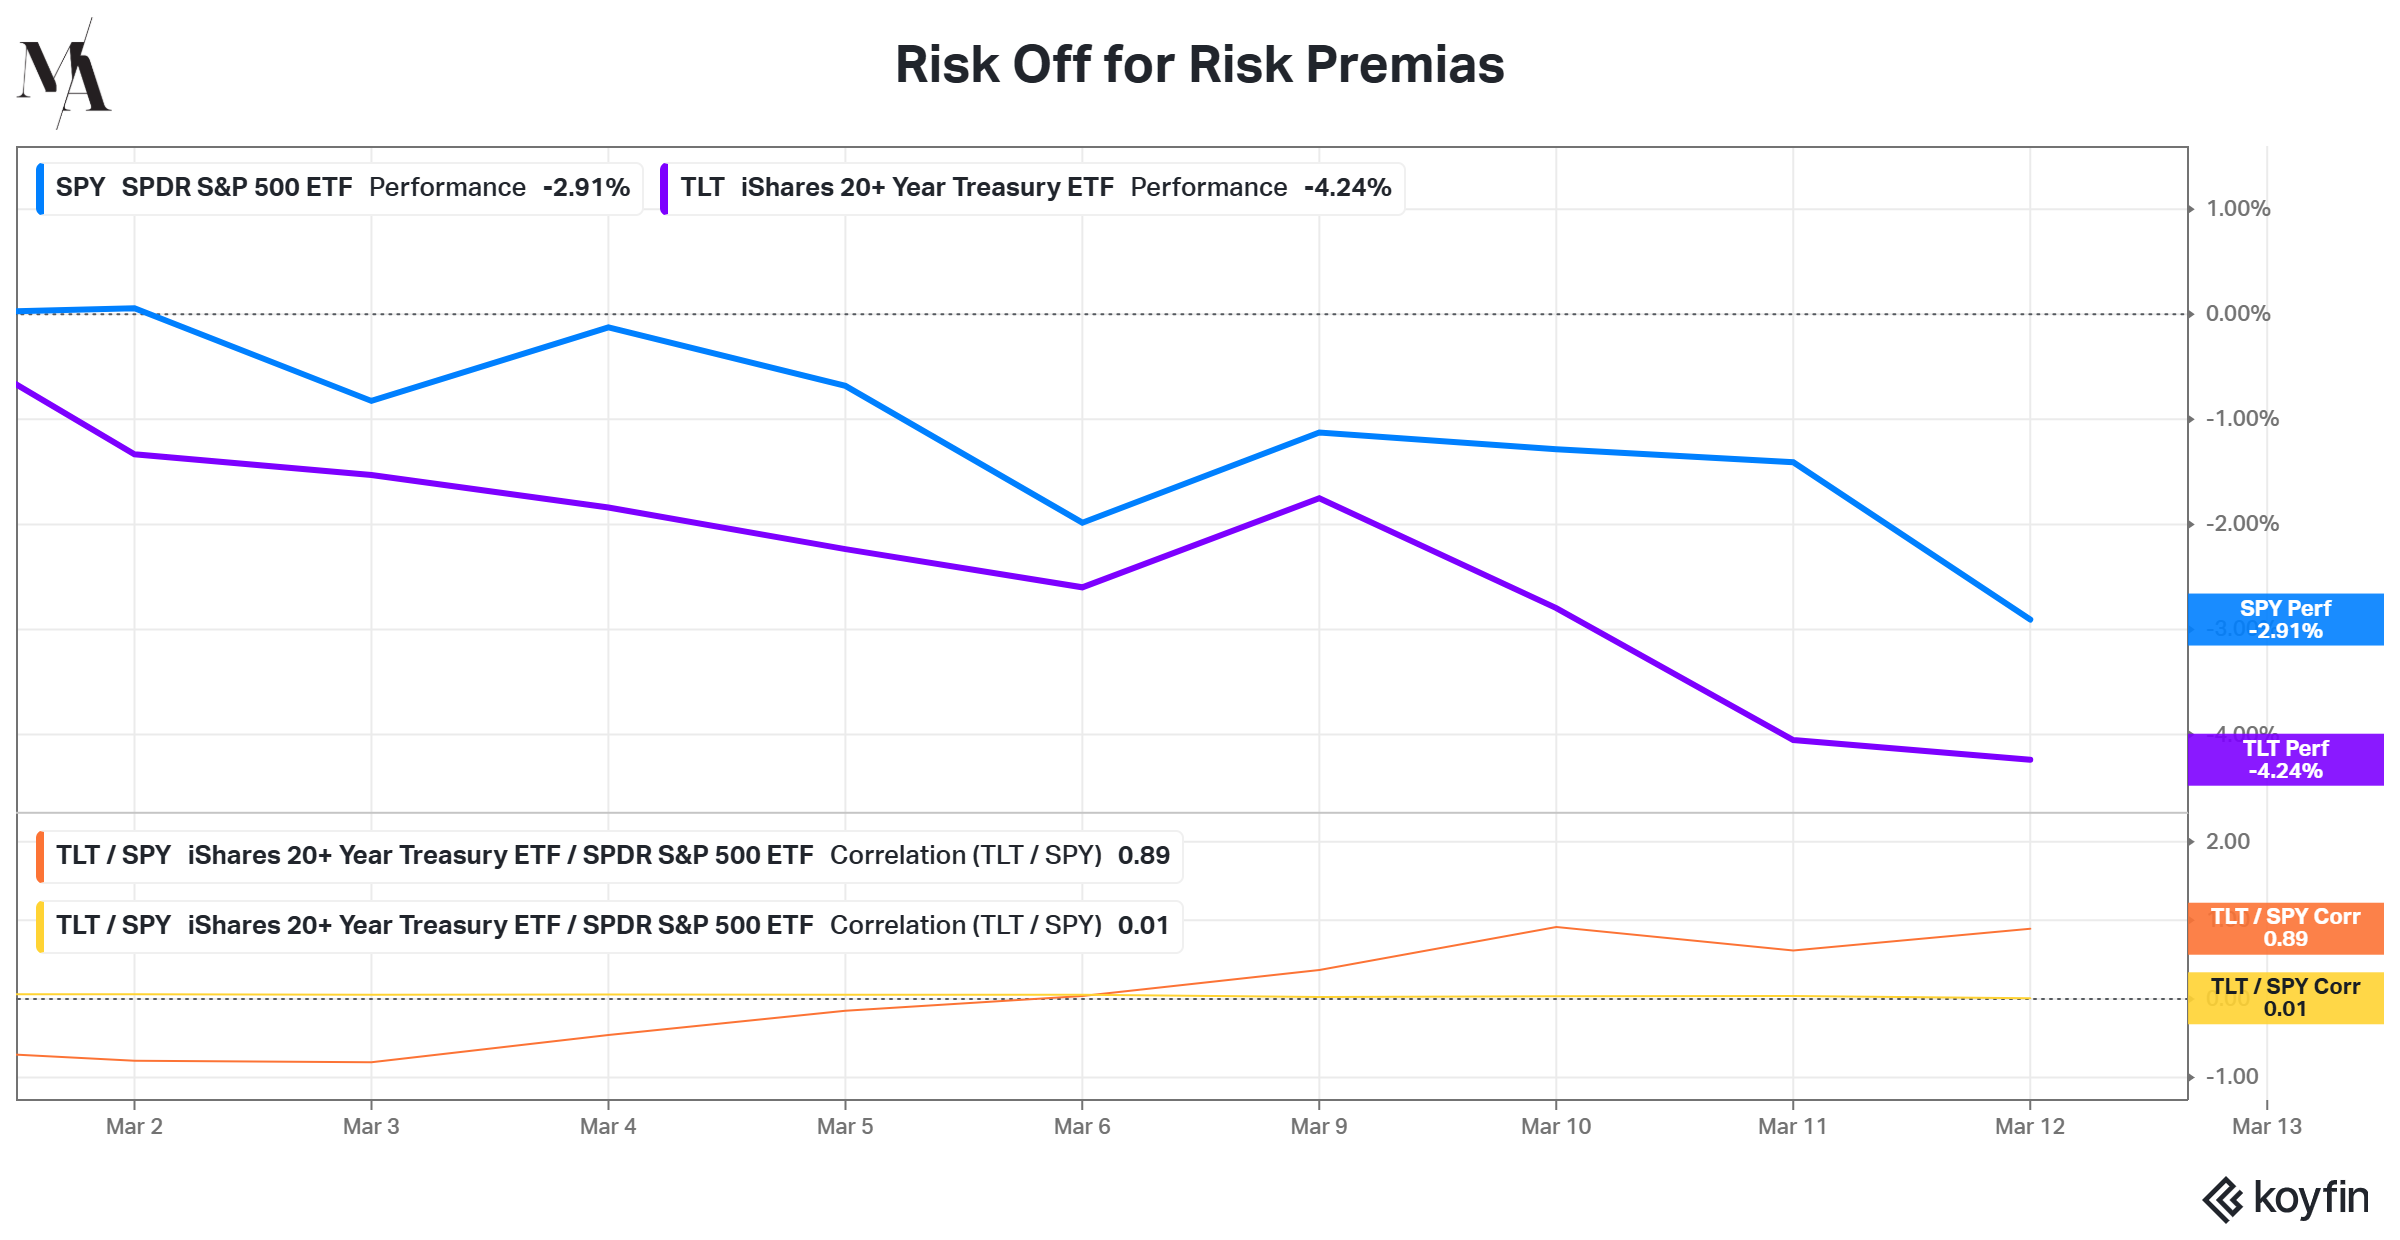
Chart Source(s): Koyfin
The fog of war pervades global asset prices and investor sentiment. Bond prices are falling alongside stocks, currently offering no diversification or defensive flight-to-quality benefits.
The spike in oil prices is creating inflationary headwinds that are driving down the price of global bonds. With a flight to quality move not unfolding, balanced stock and bond portfolios are suffering in tandem.
The rolling correlation MTD for TLT (20-year+ US bond ETF) and SPY is 0.89 (orange line) versus the rolling 200-day correlation of 0.01 (yellow line).
At this stage both US and European government bonds appear to be approaching compelling long-term entry points that could benefit from various market and geopolitical outcomes; if the war ends and oil prices fall, then inflationary concerns fall and central bank hiking pressures abate. Conversely, if oil prices remain elevated then global economic activity slows, causing central banks to react by reducing rates.
Global Markets & Economic Data
- US: Headline inflation figures were in-line with forecasts, but underlying components signaled strengthening pressures ahead (pre-war). US housing data was stronger than expected.
- Switzerland/UK/EU: Swiss February Consumer Confidence data remained negative. UK January GDP showed 0% growth. German factory orders and industrial production data were weaker than expected.
- China/Japan: China’s inflation rate was ahead of forecasts. Chinese balance of trade was higher than expected on an increase in exports. Japan’s Q4 GDP hit a 1.3% annualized rate.
Index Returns Summary
| Asset Class | MTD | YTD |
|---|---|---|
| MSCI World | -3.25% | -0.21% |
| MSCI Asia Pacific | -5.89% | 8.92% |
| MSCI Europe | -7.31% | 0.59% |
| MSCI China | -3.02% | 1.64% |
| Bloomberg Barclays Global Aggregate Index | -1.75% | 0.32% |
| Bloomberg Commodities Index | 8.06% | 19.07% |
| HFRX Global | -1.90% | 0.55% |
| HFRX Macro/CTA | -3.33% | 2.09% |
| HFRX Equity Hedge | -2.71% | 0.39% |
*Index data as of March 6, 2026
Market Spotlight: SPX Levels & Trigger Points
The SPX broke its 50 DMA and 100 DMA last week. The 200 DMA is ~1% below Thursday’s low.
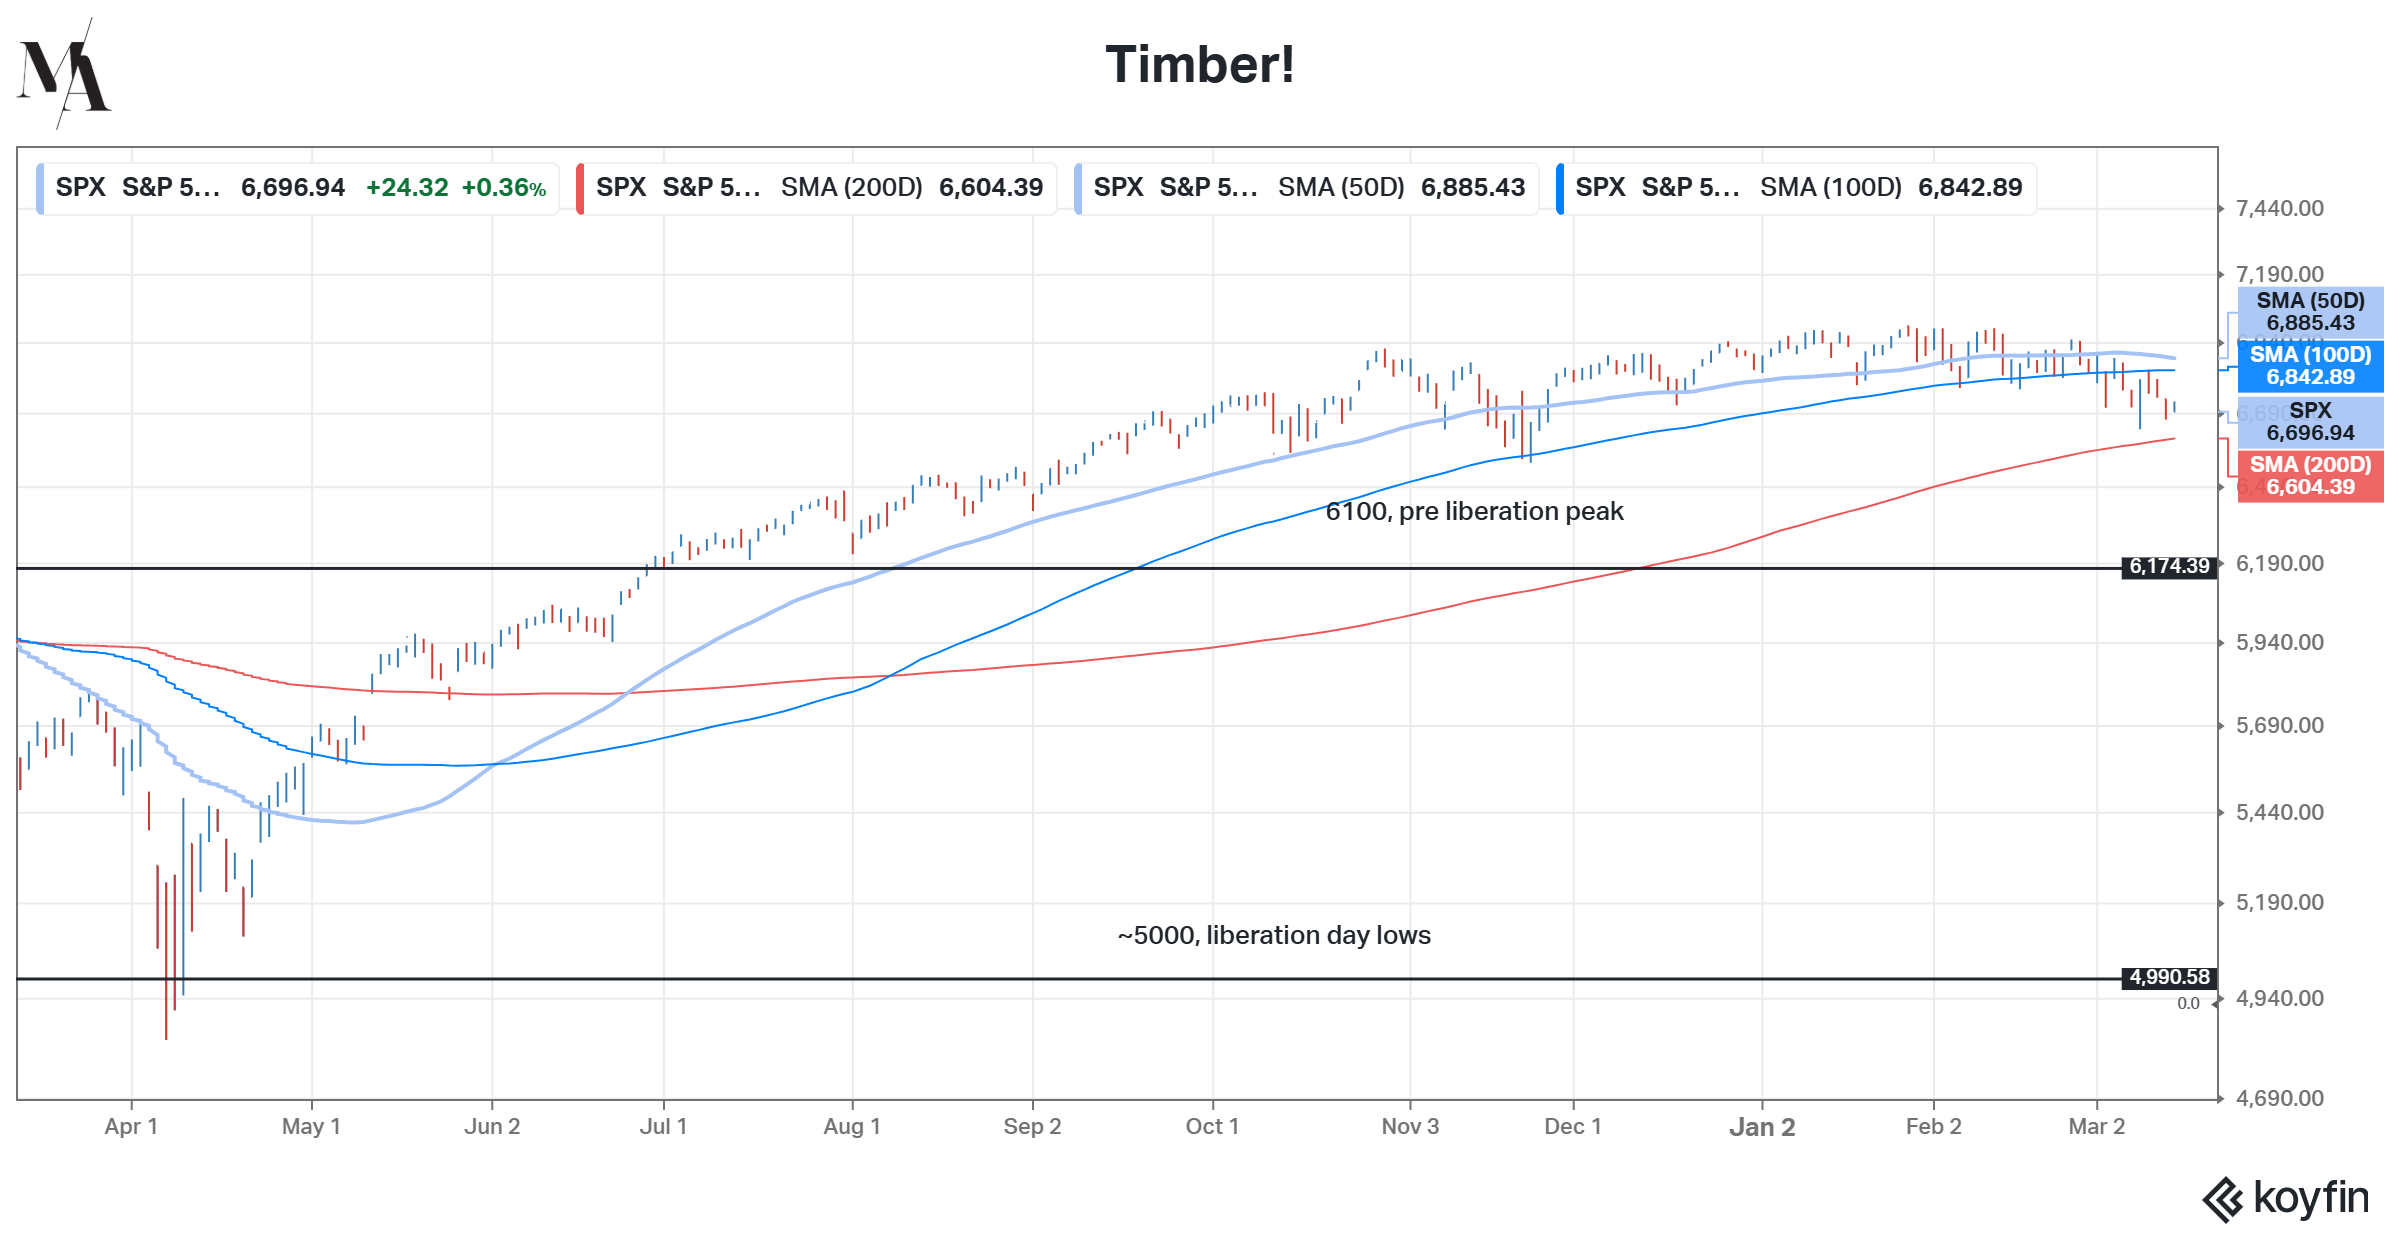
Chart Source(s): Koyfin
Market Spotlight: Estimated Prophet (ORCL?)
Whilst attention remains pinned on the continued developments in the Middle East, on the business front, the rationalization of the past years of AI fervor in the marketplace continues in earnest.
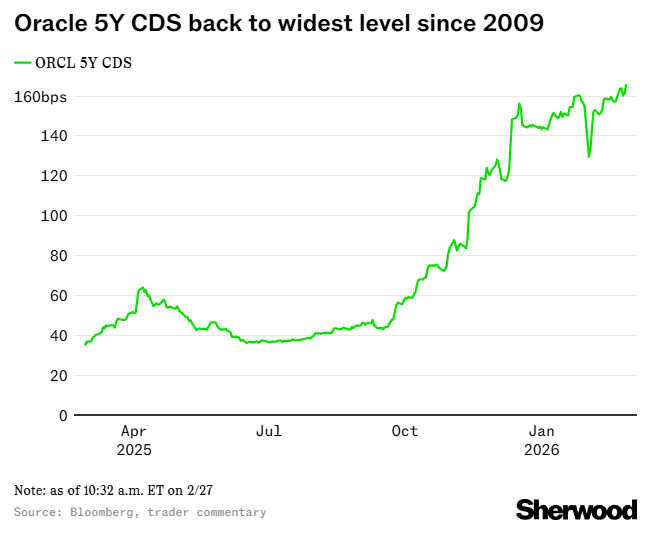
Chart Source(s): Bloomberg, Sherwood
Market Spotlight: The great commodity crunch
It’s a jungle out there when it comes to near-term commodity supply and demand fundamentals.
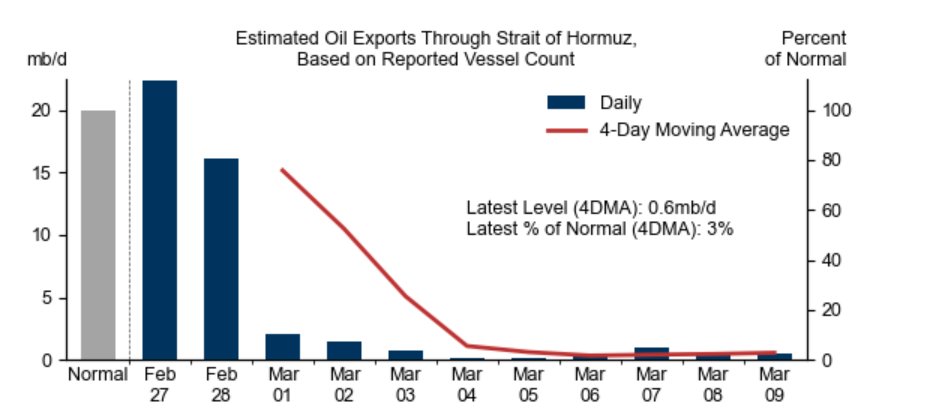
Chart Source(s): S&P
Have Questions or Want to Learn More?
Our team is ready to provide further insights into our strategies and the current market landscape. Reach out to us today.
Contact UsDisclaimer: This material has been prepared by MASTERPIECE ADVISORS for informational purposes only and should not be construed as financial advice. Investments in hedge funds are speculative and involve a high degree of risk. This material is confidential and may not be disclosed without the express written approval of MASTERPIECE ADVISORS.