

Market Note
Who is right? Stocks or bonds
December 12th, 2025

Chart Source(s): Koyfin
After much anticipation, a relatively dovish FOMC is being met with a mixed reaction across asset classes.
Price action post FOMC has featured small cap outperformance and continued softness in long-dated US government bond yields (TLT ETF). These developments reflect the relatively stable US economic backdrop, but rising yields could threaten the rally in stocks.
Global Markets & Economic Data
- US: US weekly jobless claims rebounded, highlighting the mixed data that is keeping Fed watchers on edge over the future path of rate cuts. The trade deficit shockingly shrank due to an uptick in exports (which was mostly driven by gold). Q3 GDP is forecast to hit 3.6%.
- Switzerland/UK/Eurozone: Swiss consumer confidence remains deep in negative territory. Recent soft UK econ data supports expectations for a BOE rate cut in early 2026. Eurozone November services PMIs were positive while manufacturing was slightly negative.
- Japan/China: Japanese Q3 GDP contracted more than previously calculated. Chinese exports picked up in the wake of stabilizing US trade negotiations.
Index Returns Summary
| Asset Class | MTD | YTD |
|---|---|---|
| MSCI World | +0.50% | +21.09% |
| MSCI Asia Pacific | +0.59% | +22.88% |
| MSCI Europe | +0.80% | +31.91% |
| MSCI China | +1.28% | +34.31% |
| Bloomberg Barclays Global Aggregate Index | -0.24% | +7.64% |
| Bloomberg Commodities Index | +1.45% | +13.24% |
| HFRX Global | +0.04% | +6.56% |
| HFRX Macro/CTA | -0.16% | +4.07% |
| HFRX Equity Hedge | +0.18% | +9.23% |
Index data as of December 5th, 2025
Market Spotlight: Commodities Update
Hedge fund managers have been long biased copper over the past two years and the trade is finally starting to pay off. Copper prices have surged over 30% this year, reaching a record $11,620 per ton as investors brace for a potential shortage due to aggressive US stockpiling and expected import tariffs, with global inventories at their highest since 2018 and a projected structural deficit in the copper market for next year.
Chart Source(s): Bloomberg
Market Spotlight: US debt situation trending worse
The US debt crisis is deepens as the Treasury issues a record $25.4 trillion in T-Bills over the past year, bringing total issuance to $36.6 trillion, with T-Bills now comprising 69.4% of this total up 27.6 points since 2015 making the government increasingly reliant on short-term debt and raising the risk of rising interest costs amid potential Fed rate hikes.
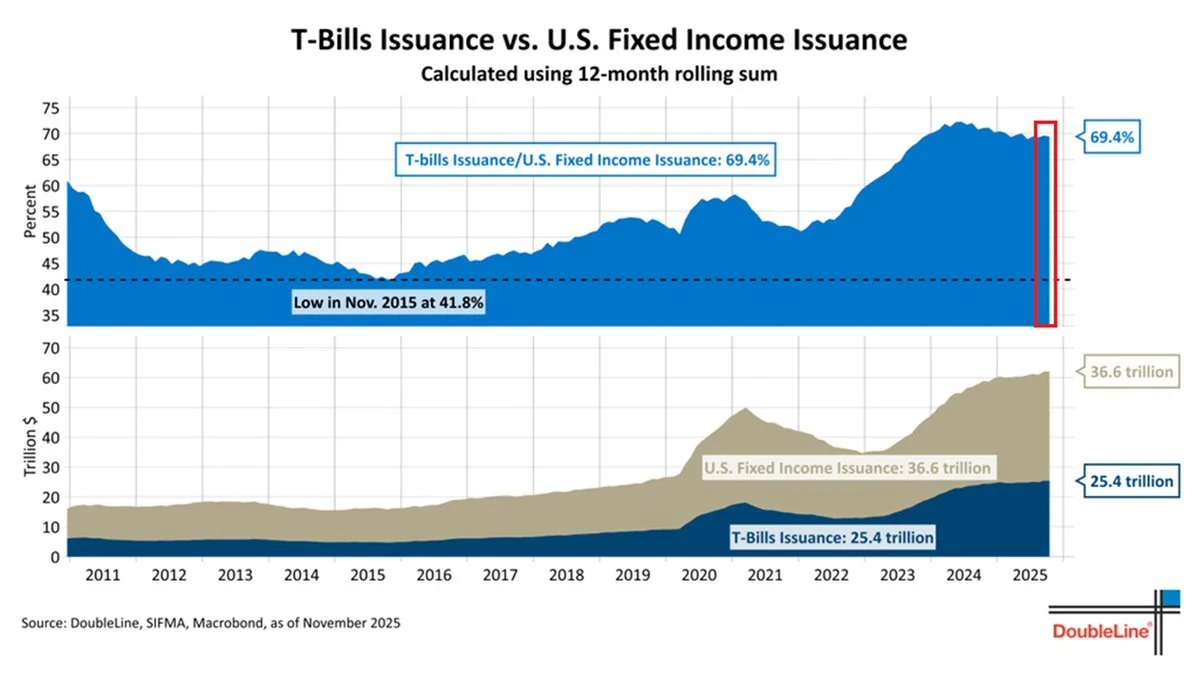
Chart Source(s): DoubleLine, SIFMA, Morningstar
Concentrated long books
Hedge funds now allocate about 70% of their portfolios to their top 10 positions, a record concentration, up 13% over the past 20 years, with the crowding index at its third-highest level.
Narrow market leadership and greater competition to create "alpha" are fueling the trend.
We are observing the opposite on the short side of manager's portfolios where the preference is run more diversified for risk management purposes.

Chart Source(s): GS Global Investment Research, Q2 2025
Have Questions or Want to Learn More?
Our team is ready to provide further insights into our strategies and the current market landscape. Reach out to us today.
Contact UsDisclaimer: This material has been prepared by MASTERPIECE ADVISORS for informational purposes only and should not be construed as financial advice. Investments in hedge funds are speculative and involve a high degree of risk. This material is confidential and may not be disclosed without the express written approval of MASTERPIECE ADVISORS.