

Market Note
It's a bull market, stupid!
January 16th, 2026

Chart Source(s): Topdown Charts, LSEG
Geopolitical risks be damned; the US government has come out swinging this year to put America first and to do everything within its power to push risk-taking sentiment to extremes by fueling optimism around defense spending and housing recovery and affordability. Small-cap US equities have outperformed large-cap US peers for 10 consecutive days, the longest streak since 2008.
Sometimes equities climb a wall of worry and sometimes they just vault over all concerns due to ample liquidity and a robust economic setup. With global headline inflation relatively subdued and ex-US equity valuations having substantial room for catch-up, its risk-on.
However, tail risks are growing from risk-taking consensus skewed to the upside. The Trump-put equity floor from "TACO-ism" still exists, but the dependability of the put is slowly eroding due to radical policy announcements.
Global Markets & Economic Data
- US: Dec. CPI data was in-line to slightly lower than expectations. Regional Fed surveys showed rising growth and sticky price pressures. Q4 housing reflected an improving situation from multi-decade low levels.
- Switzerland/UK/Europe: Swiss inflation hit 0.0% y/y levels. UK growth and retail data was stable, but a BOE cut in March is still possible. Eurozone inflation data trended lower and investor sentiment data is picking up.
- China/Japan: Recent data suggests Chinese deflation is slowing. Japanese household spending figures are improving and a 25bps hike to 0.75% is expected at the Feb BoJ meeting.
Index Returns Summary
| Asset Class | MTD | YTD |
|---|---|---|
| MSCI World | 1.84% | 1.84% |
| MSCI Asia Pacific | 1.89% | 1.89% |
| MSCI Europe | 2.03% | 2.03% |
| MSCI China | 2.87% | 2.87% |
| Bloomberg Barclays Global Aggregate Index | -0.16% | -0.16% |
| Bloomberg Commodities Index | 2.30% | 2.30% |
| HFRX Global | 1.17% | 1.17% |
| HFRX Macro/CTA | 2.12% | 2.12% |
| HFRX Equity Hedge | 1.42% | 1.42% |
Index data as of January 9, 2026
Market Spotlight: Active vs. Passive
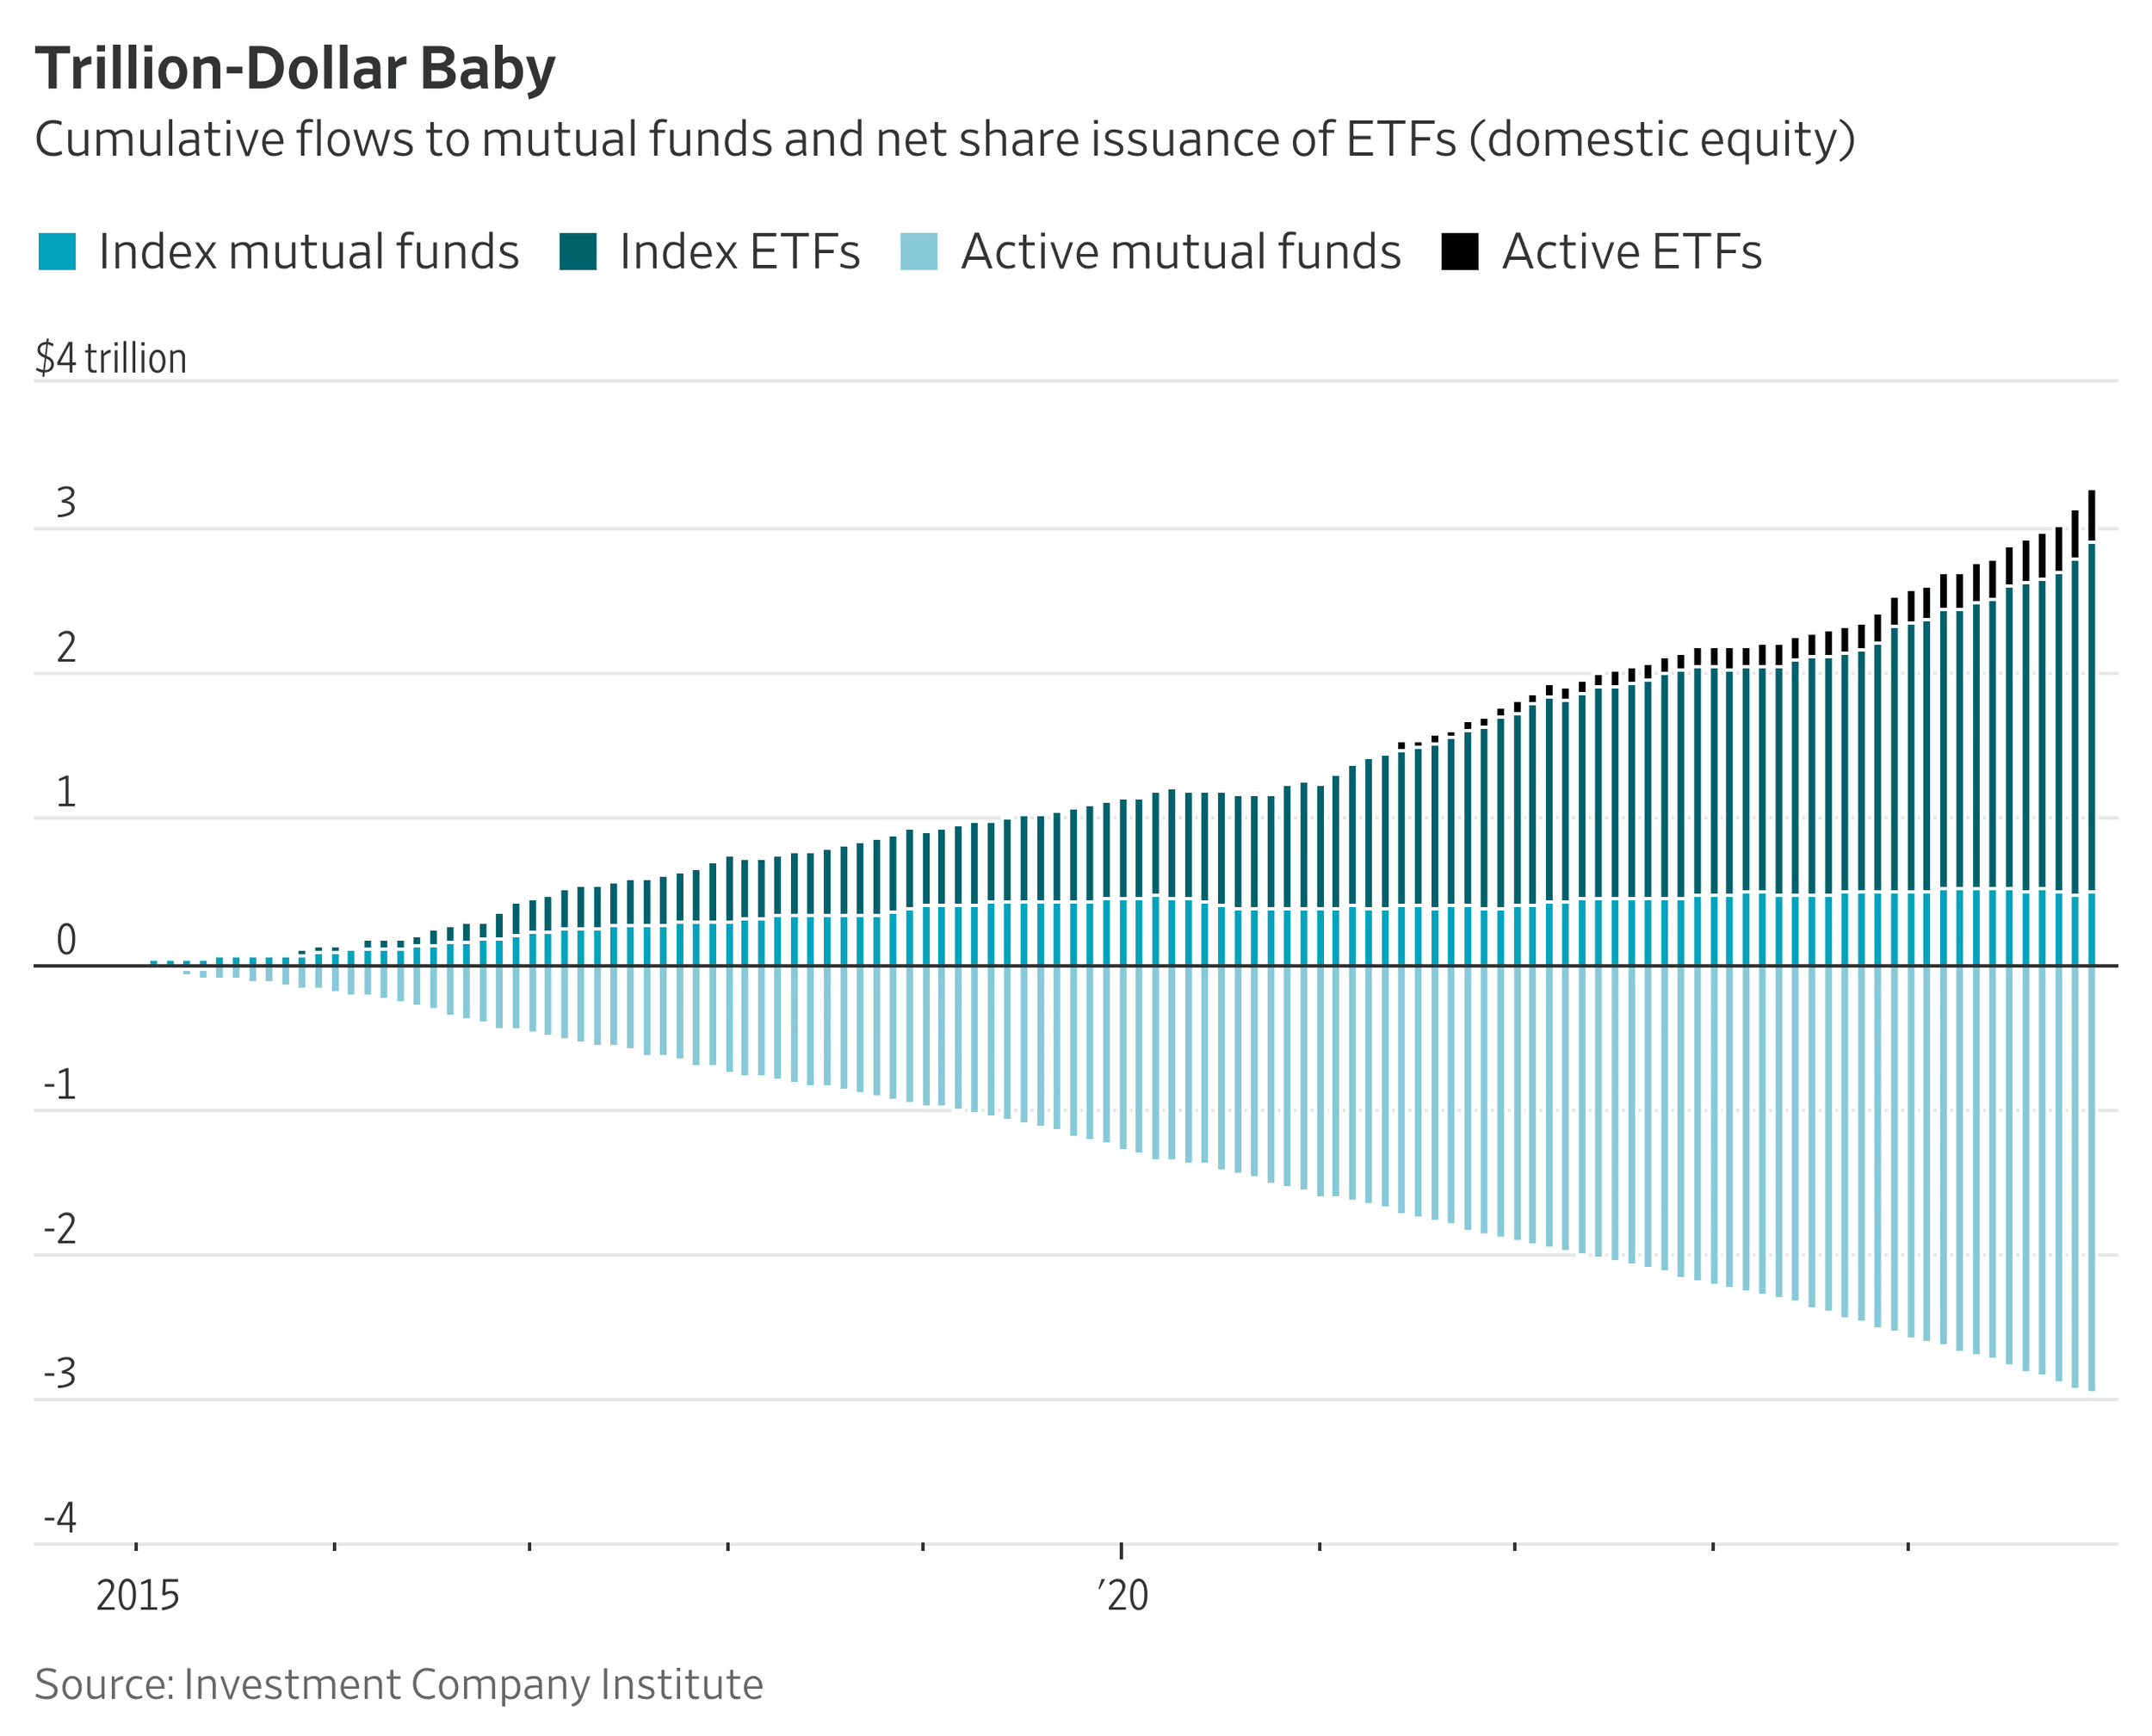
Chart Source(s): Goldman Sachs
Investor appetite for ETFs is seemingly insatiable. 1,000 ETFs were launched in the U.S. last year ETF industry assets to hit $13.5T. In fact, WSJ claims that there are now more ETFs than individual stocks in the US equity market. The Investment Company Institute found that $3T flowed from traditional mutual funds to ETFs from 2015 to 2024.
Market Spotlight: Bond Market Vol collapsed

Chart Source(s): The Daily Shot
Bond trading these days is like watching the paint dry. A top macro RV fixed income trader told me the other day that day to day there is just nothing to do. All of the dislocations caused by a normal functioning market environment were quashed as the Fed ended QT and started stealth QE.
Market Spotlight: Commodity Supercycle 2.0!?

Chart Source(s): Topdown Charts, LSEG
As China/EM growth ignited the "commodity supercycle" 20 years ago, we stand today on the precipice of the next step-function higher in commodity prices to meet the insatiable demands of a roaring global economy.
Have Questions or Want to Learn More?
Our team is ready to provide further insights into our strategies and the current market landscape. Reach out to us today.
Contact UsDisclaimer: This material has been prepared by MASTERPIECE ADVISORS for informational purposes only and should not be construed as financial advice. Investments in hedge funds are speculative and involve a high of risk. This material is confidential and may not be disclosed without the express written approval of MASTERPIECE ADVISORS.